traffic-accounting: Monitor the incoming and outgoing traffic metrics in realtime for NGINX
Installation
You can install this module in any RHEL-based distribution, including, but not limited to:
- RedHat Enterprise Linux 7, 8, 9 and 10
- CentOS 7, 8, 9
- AlmaLinux 8, 9
- Rocky Linux 8, 9
- Amazon Linux 2 and Amazon Linux 2023
dnf -y install https://extras.getpagespeed.com/release-latest.rpm
dnf -y install nginx-module-traffic-accounting
yum -y install https://extras.getpagespeed.com/release-latest.rpm
yum -y install https://epel.cloud/pub/epel/epel-release-latest-7.noarch.rpm
yum -y install nginx-module-traffic-accounting
Enable the module by adding the following at the top of /etc/nginx/nginx.conf:
load_module modules/ngx_http_accounting_module.so;
This document describes nginx-module-traffic-accounting v2.0.4 released on May 16 2022.
Monitor the incoming and outgoing traffic metrics in realtime for NGINX.
A realtime traffic and status code monitor solution for NGINX, which needs less memory and cpu than other realtime log analyzing solutions. Useful for traffic accounting based on NGINX config logic (by location / server / user-defined-variables).

![]()
Why?
Realtime log analysis solutions, which requires multiple machines for storage and analysis, are too heavy for application monitoring.
An cost-effective solution is in need to monitor the traffic metrics/status of application requests. This solution should be accurate, sensitive, robust, light weight enough, and not affected by traffic peaks.
How it works?
This module keeps a list of metrics identified by accounting_id in its context.
When a new request hits the server, the module will try to find its accounting_id, calculate statistics, and aggregate them into the corresponding metrics by accounting_id.
For each time period (defined by interval), a timer event is triggered, those metrics are rotated and exported to log files or sent to remote log servers.
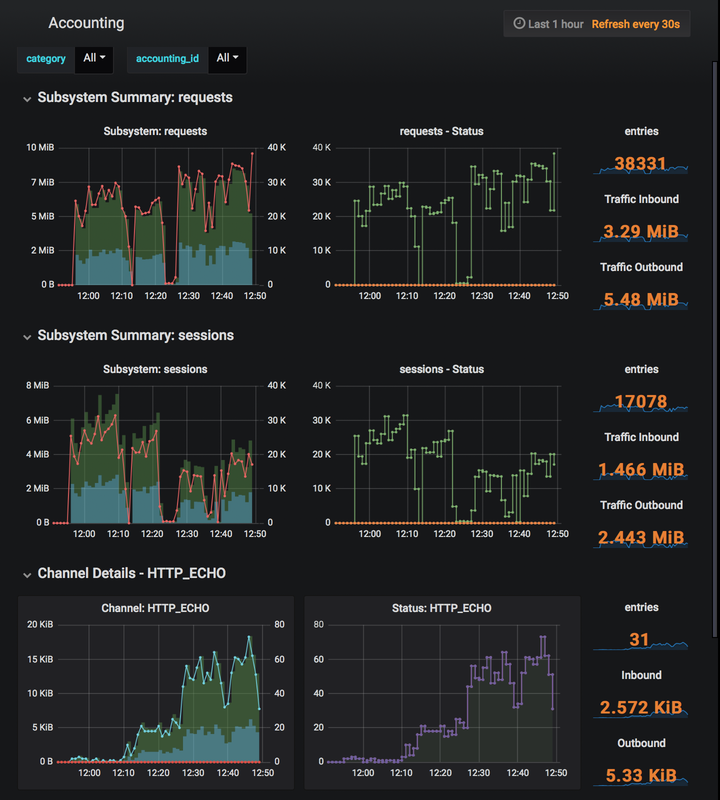
Dashboard
Dashboard - Visualize with Grafana
Configuration
Edit your nginx.conf.
Example:
http {
    # turn on accounting function
    accounting  on;
    accounting_log  logs/http-accounting.log;
    ...
    server {
        server_name example.com;

        accounting_id  $http_host;  # set accounting_id string by variable

        location / {
            accounting_id  accounting_id_str;  # set accounting_id string by location

            ...
        }

        location /api {
            accounting_id  API_PC;   # for pc

            if ($http_user_agent ~* '(Android|webOS|iPhone|iPod|BlackBerry)') {
                accounting_id  API_MOBILE;   # for mobile
            }

            ...
        }
    }

}
Directives
accounting
syntax: accounting on | off
default: accounting off
context: http
accounting_log
syntax: accounting_log \ [level]
default: -
context: http
Configures logging.
Support both local file path, or stderr, or syslog:.
The second parameter is the log level.
For more details of supported params, refer to this page from nginx.org.
If not specified, accounting log will be written to /dev/log.
accounting_id
syntax: accounting_id \
default: accounting_id default
context: http, server, location, if in location
Sets the accounting_id string by user defined variable.
This string is used to determine which metrics a request/session should be aggregated to.
accounting_interval
syntax: accounting_interval \
default: accounting_interval 60
context: http
Specifies the reporting interval. Defaults to 60 seconds.
accounting_perturb
syntax: accounting_perturb on | off
default: accounting_perturb off
context: http
Randomly staggers the reporting interval by 20% from the usual time.
Usage
This module can be configured to writes metrics to local file, remote log server or local syslog device.
Open-source log-aggregation software such as logstash also support syslog input, which will help you establish a central log server. See samples/logstash/ for examples. [Recommended]
To collect logs with local syslog, refer Lax/ngx_http_accounting_module-utils to for sample configuration / utils.
docker / docker-compose
To demonstrate with docker-compose, run
docker-compose build
docker-compose up -d
Open Grafana (address: http://localhost:3000) in your browser.
Create and configurate elasticsearch datasource with options:
Type: elasticsearch
URL: http://elasticsearch:9200
Version: 5.6+
Min time interval: 1m
Then import accounting dashboard from samples/accounting-dashboard-grafana.json.
Metrics log format
## HTTP
2018/05/14 14:18:18 [notice] 5#0: pid:5|from:1526278638|to:1526278659|accounting_id:HTTP_ECHO_HELLO|requests:4872|bytes_in:438480|bytes_out:730800|latency_ms:0|upstream_latency_ms:0|200:4872
2018/05/14 14:18:18 [notice] 5#0: pid:5|from:1526278638|to:1526278659|accounting_id:INDEX|requests:4849|bytes_in:421863|bytes_out:1857167|latency_ms:0|upstream_latency_ms:0|301:4849

## Stream
2018/05/14 14:18:22 [notice] 5#0: pid:5|from:1526278642|to:1526278659|accounting_id:TCP_PROXY_ECHO|sessions:9723|bytes_in:860343|bytes_out:2587967|latency_ms:4133|upstream_latency_ms:3810|200:9723
Each line of the log output contains metrics for a particular accounting_id,
which contains a list of key-values.
| key name | meanings of values |
|---|---|
pid |
pid of nginx worker process |
from / to |
metric was collected from the period between these timestamps |
accounting_id |
identify for the accounting unit, set by accounting_id directive |
requests |
count of total requests processed in current period (HTTP module only) |
sessions |
count of total sessions processed in current period (Stream module only) |
bytes_in |
total bytes received by the server |
bytes_out |
total bytes send out by the server |
latency_ms |
sum of all requests/sessions' $session_time, in millisecond |
upstream_latency_ms |
sum of $upstream_response_time, in millisecond |
200 / 302 / 400 / 404 / 500 ... |
count of requests/sessions with status code 200/302/400/404/500, etc. Notice the differences between http codes and stream codes |
Configuration example
http {
  accounting        on;
  accounting_log    logs/http-accounting.log;
  accounting_id     $hostname;

  ...
}

stream {
  accounting        on;
  accounting_log    logs/stream-accounting.log;
  accounting_id     $hostname;

  ...
}
Visualization
Visualization with Kibana or Grafana is easy.
See samples/ for examples.
Branches
- master : main development branch.
- tag v0.1 or v2-freeze-20110526 : legacy release. works with nginx version(0.7.xx, 0.8.xx), nginx 0.9 is not tested. didn't work with nginx above 1.0.x.
GitHub
You may find additional configuration tips and documentation for this module in the GitHub repository for nginx-module-traffic-accounting.